Data tells stories, but most people never hear them. Spreadsheets full of numbers sit silently on hard drives while the insights they contain remain locked away, inaccessible to the people who need them most. Business decisions get made on gut feelings rather than evidence, and opportunities slip by unnoticed.
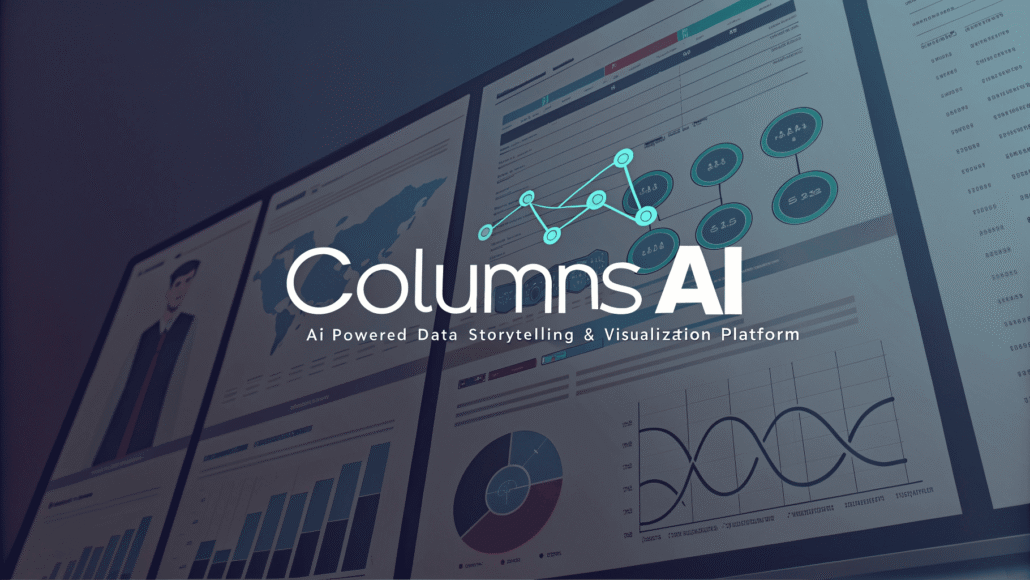
Columns AI changes this dynamic by transforming complex data into clear, compelling narratives that anyone can understand and act upon. This AI-powered platform doesn’t just create charts and graphs—it interprets your data, identifies meaningful patterns, and crafts visual stories that reveal insights you might have missed.
Whether you’re a business analyst trying to communicate findings to executives, a marketer measuring campaign performance, or a researcher presenting study results, Columns AI bridges the gap between raw data and actionable understanding. The platform combines advanced artificial intelligence with intuitive design to make data storytelling accessible to professionals regardless of their technical background.
By the end of this post, you’ll understand how Columns AI can revolutionize your approach to data analysis and visualization, helping you uncover insights faster and communicate them more effectively than ever before.
How AI-Powered Data Storytelling Works
Traditional data analysis follows a predictable pattern: collect information, create charts, interpret results, then struggle to explain findings to others who don’t share your analytical background. This process often leaves crucial insights buried in technical details that non-experts find difficult to grasp.
Columns AI flips this approach by starting with the story your data wants to tell. The platform uses artificial intelligence to analyze your datasets, identifying patterns, trends, and anomalies that matter most. Instead of requiring you to know which questions to ask, the AI explores your data systematically and surfaces the most significant findings automatically.
Intelligent Pattern Recognition
The AI engine examines your data through multiple analytical lenses simultaneously. It looks for seasonal trends, correlation patterns, outliers, and statistical relationships that might take human analysts days or weeks to identify manually. This comprehensive analysis ensures that important insights don’t get overlooked due to time constraints or analytical blind spots.
Machine learning algorithms continuously improve the platform’s ability to recognize meaningful patterns across different data types and industries. The system learns from each analysis, becoming more sophisticated at identifying the types of insights that drive real business value.
Automated Insight Generation
Once patterns are identified, Columns AI automatically generates plain-language explanations of what the data reveals. These insights go beyond simple descriptions of charts—they explain why trends matter, what factors might be driving changes, and what implications the findings might have for decision-making.
The platform can identify relationships between seemingly unrelated variables, helping you understand complex cause-and-effect dynamics within your data. This automated insight generation saves countless hours while often revealing connections that manual analysis might miss.
Visual Storytelling That Engages Audiences
Numbers alone rarely inspire action. Columns AI transforms analytical findings into visual narratives that capture attention and drive understanding. The platform automatically selects the most appropriate visualization methods for your data, ensuring that each insight gets presented in the clearest, most compelling way possible.
Smart Visualization Selection
Different types of data require different visualization approaches. Columns AI understands these nuances and automatically chooses chart types, color schemes, and layouts that best communicate your specific insights. Time-series data might become an animated line chart that shows progression over time, while comparison data transforms into interactive bar charts that highlight key differences.
The AI considers not just the data type, but also the story being told. A dataset showing gradual improvement over time receives different visual treatment than one revealing sudden changes or concerning trends. This contextual approach ensures that the visual presentation reinforces rather than obscures the underlying message.
Interactive Data Exploration
Static charts limit audience engagement and understanding. Columns AI creates interactive visualizations that allow viewers to explore data from multiple angles. Users can filter information, adjust time ranges, and drill down into specific segments without needing technical skills or separate analysis tools.
These interactive elements transform passive data consumption into active exploration. Stakeholders can investigate questions that arise during presentations, building confidence in the findings and discovering additional insights that drive better decision-making.
Narrative Flow and Context
Columns AI structures insights into logical narratives that guide viewers through complex findings step by step. Rather than presenting isolated charts, the platform creates cohesive stories that build understanding progressively. Each visualization connects to the next, creating a clear path from raw data to actionable conclusions.
Contextual information accompanies each insight, helping viewers understand not just what the data shows, but why it matters and how it relates to broader business objectives. This narrative approach makes complex analysis accessible to diverse audiences with varying levels of analytical expertise.
Streamlining the Analysis Process
Data analysis traditionally requires significant time investments and specialized skills. Columns AI democratizes this process, enabling professionals across different roles and skill levels to generate sophisticated insights quickly and efficiently.
Automated Data Preparation
Raw data rarely arrives in analysis-ready format. Columns AI handles common data preparation tasks automatically, including cleaning inconsistencies, handling missing values, and identifying data quality issues. This automation eliminates hours of tedious preparation work while reducing the risk of errors that can compromise analysis accuracy.
The platform recognizes different data formats and structures, adapting its processing approach accordingly. Whether you’re working with sales data, survey responses, financial records, or operational metrics, Columns AI understands the context and prepares your information appropriately.
Rapid Insight Discovery
Traditional analysis often involves formulating hypotheses, testing them systematically, and iterating through multiple analytical approaches. Columns AI accelerates this process by exploring multiple analytical pathways simultaneously. The platform can complete comprehensive analyses in minutes that might take human analysts hours or days.
This speed advantage proves particularly valuable when dealing with time-sensitive decisions or when exploring large datasets with many potential relationships. The AI can quickly identify the most promising analytical directions, allowing you to focus your time on interpreting and acting on the most significant findings.
Collaborative Analysis Features
Data insights become more powerful when they can be easily shared and discussed. Columns AI includes collaboration features that enable teams to work together on analysis projects, share findings, and build on each other’s discoveries. Comments, annotations, and shared workspaces facilitate productive discussions around data-driven insights.
Version control and change tracking ensure that collaborative analysis projects remain organized and transparent. Team members can see how insights evolved over time and understand the reasoning behind specific analytical choices.
Real-World Applications Across Industries
Columns AI serves diverse analytical needs across multiple industries and use cases. Understanding these applications helps identify specific ways the platform can enhance your data analysis workflows and decision-making processes.
Business Performance Analysis
Companies use Columns AI to analyze sales performance, customer behavior, and operational efficiency. The platform can quickly identify which products, regions, or time periods drive the strongest results, helping managers allocate resources more effectively. Automated insights often reveal unexpected patterns that inform strategic planning and tactical adjustments.
Marketing teams leverage the platform to measure campaign effectiveness, understand customer segmentation, and optimize spending across different channels. The visual storytelling capabilities make it easier to communicate ROI findings to executives and secure budget approval for successful initiatives.
Financial Planning and Analysis
Finance professionals use Columns AI to analyze budget performance, forecast trends, and identify cost optimization opportunities. The platform can automatically flag unusual expense patterns, revenue fluctuations, or emerging financial risks that require attention. Interactive dashboards enable real-time monitoring of key financial metrics.
The AI’s ability to identify correlations between different financial variables helps analysts understand complex relationships within organizational spending and revenue patterns. These insights inform more accurate forecasting and strategic financial planning.
Research and Academic Analysis
Researchers across various fields use Columns AI to analyze survey data, experimental results, and longitudinal studies. The platform’s ability to handle complex datasets and identify subtle patterns proves particularly valuable for academic research where statistical significance and methodology rigor are essential.
The automated insight generation helps researchers identify unexpected findings that might warrant further investigation. Visual storytelling capabilities make it easier to communicate research findings to both academic peers and broader audiences.
Operations and Supply Chain Optimization
Operations managers use Columns AI to analyze production efficiency, supply chain performance, and quality metrics. The platform can identify bottlenecks, predict maintenance needs, and optimize resource allocation based on historical patterns and current conditions.
Real-time data integration enables continuous monitoring of operational performance, with automated alerts when metrics deviate from expected ranges. This proactive approach helps prevent problems before they impact business operations significantly.
Getting Started With Data Storytelling
Implementing Columns AI into your analytical workflow requires strategic planning and clear objectives. Understanding best practices helps you maximize the platform’s value from the beginning and avoid common pitfalls that can limit effectiveness.
Defining Your Analytical Objectives
Begin each analysis project with clear questions you want to answer or decisions you need to make. While Columns AI can discover unexpected insights, having specific objectives helps focus the analysis and ensures that results align with your actual needs. Consider both immediate questions and longer-term strategic interests.
Document your objectives and share them with stakeholders who will use the insights. This alignment ensures that the analysis addresses real business needs and that findings receive appropriate attention and action when they’re delivered.
Preparing Your Data Strategy
Successful data storytelling depends on having access to relevant, high-quality information. Evaluate your current data sources and identify gaps that might limit analytical effectiveness. Consider how different datasets can be combined to create more comprehensive insights.
Establish processes for regular data updates and quality monitoring. Columns AI can handle many data preparation tasks automatically, but maintaining consistent data quality at the source improves analysis accuracy and reliability.
Building Analytical Capabilities
While Columns AI makes advanced analysis accessible to non-experts, developing basic analytical literacy across your organization enhances the platform’s value. Provide training on interpreting insights, asking productive analytical questions, and translating findings into actionable strategies.
Encourage experimentation and exploration within the platform. The interactive features and automated insight generation make it safe for users to investigate different analytical approaches without risking data integrity or analysis accuracy.
Unlock the Stories Within Your Data
Columns AI represents a fundamental shift in how organizations approach data analysis and insight generation. By combining artificial intelligence with intuitive design, the platform makes sophisticated analytical capabilities accessible to professionals regardless of their technical background or statistical expertise.
The platform’s strength lies not just in its analytical power, but in its ability to communicate findings clearly and compellingly. Data-driven decisions become more common when insights are presented in ways that engage stakeholders and inspire action. Columns AI bridges the gap between analytical sophistication and practical application.
Consider the analytical challenges your organization faces regularly. How much time do you spend preparing data, creating visualizations, and explaining findings to others? Columns AI can streamline these processes while often delivering deeper insights than manual analysis typically achieves.
The combination of automated insight discovery, intelligent visualization, and collaborative features makes Columns AI valuable for anyone working with data regularly. Whether you’re measuring performance, planning strategy, or conducting research, the platform can enhance your analytical capabilities and improve your results.
Start exploring how AI-powered data storytelling can transform your approach to analysis and decision-making. The insights waiting within your data might surprise you—and the stories they tell could change how your organization operates and competes.
Related posts:
 Rows AI: Next‑Gen Spreadsheet with Built‑in AI Analyst & Automation
 Anaplan: Connected Planning Platform for Smarter Business
 Varicent: AI-Powered Sales Performance & Incentive Compensation Platform
 Qualtrics: Leading Experience Management Platform for Data-Driven Insights
 Survicate: Customer Feedback and Survey Software for Smarter Decisions
 GPT For Work: AI Add‑Ins for Excel, Word, Sheets & Docs